We started class today by going over all the questions that were posted from IW 2 and 3.
IW 2:
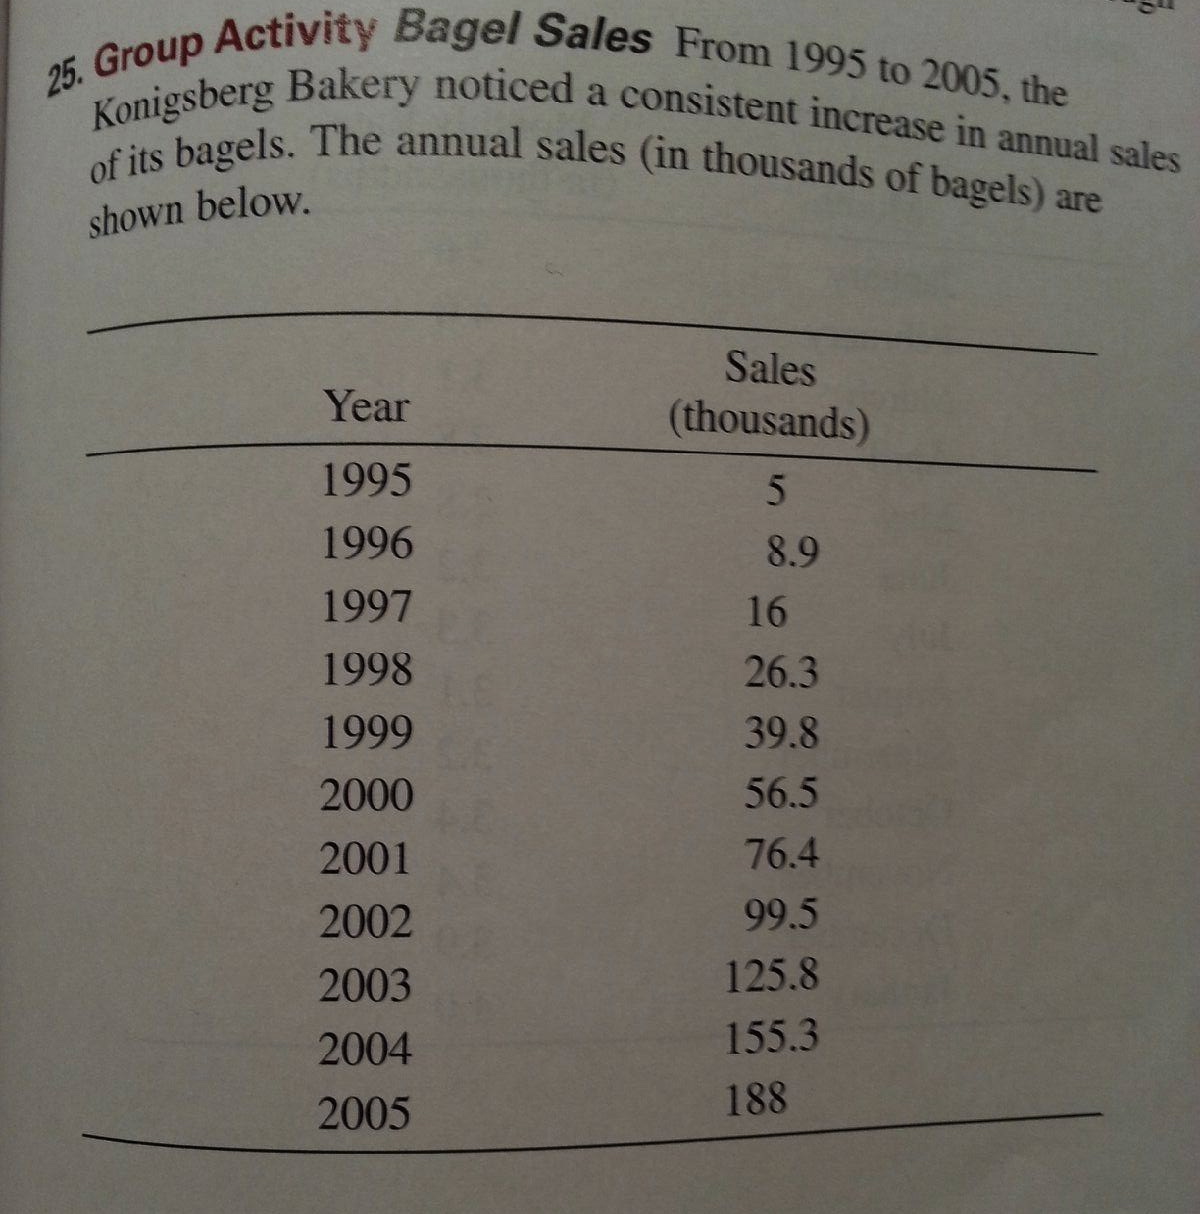
25) This problem was a quadratic regression problem (good thing to know for the quiz on Wednesday). It gave a set of data and asked you to use that data to find a quadratic equation that fit the given data. To do this we use our graphing calculators.
33) This problem asked you to find the area between the two given curves over a certain interval.
Because we are only finding the area we can switch the x and the y and still get the same area.
IW 2:
25) This problem was a quadratic regression problem (good thing to know for the quiz on Wednesday). It gave a set of data and asked you to use that data to find a quadratic equation that fit the given data. To do this we use our graphing calculators.
- First the data has to be entered into the calculator as a list: STAT -> edit -> enter data into L1 and L2 - in this case L1 is the year and L2 is the sales. To find the total number of sales made all you have to do is sum L2: 2nd -> STAT -> scroll over to math at the top -> 5. sum(. Then put in L2 by doing 2nd -> 2 and enter. That will give you the total number of sales, or the sum of list 2.
- Once data is in the list to get a graph go to 2nd -> Y= -> choose Plot 1. This gives you options for your graph. Now you can graph it. After graphing it go to zoomstat to automatically set the window.
- Now to see the regression or the quadratic that fits the data points on the graph go to: STAT -> over to CALC at the top -> down to 5. QuadReg and hit enter. This will give you the a,b, and c values for the quadratic equation.
- QuadReg by default does a regression for L1 and L2 but you can add other lists too. You can also do QuadReg -> VARS -> Y-VARS -> function -> Y1. Which puts the quadratic equation generated by QuadReg in for Y1.
- To calculate the integral you go to your graph and do 2nd -> CALC -> 7th option. The problem with integrating from the graph is that it isn't as accurate as fnInt, so its not the best thing to use on the AP test but it does give you a nice visual representation of what the fnInt value is.
33) This problem asked you to find the area between the two given curves over a certain interval.
Because we are only finding the area we can switch the x and the y and still get the same area.


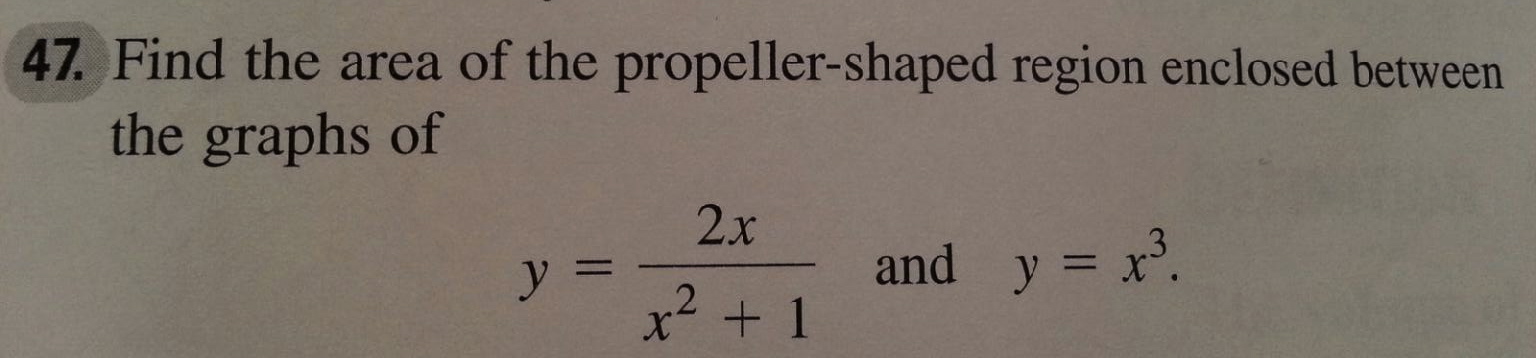
47) Another area between curves problem.

Volumes:
After learning how to find the area between two curves last class, today we learned how to find the volume between two curves. Mr. O'Brien explained it to us with a few different example problems.
- ex/ The region bounded by
,
, and
is rotated about the x-axis. Find the volume.
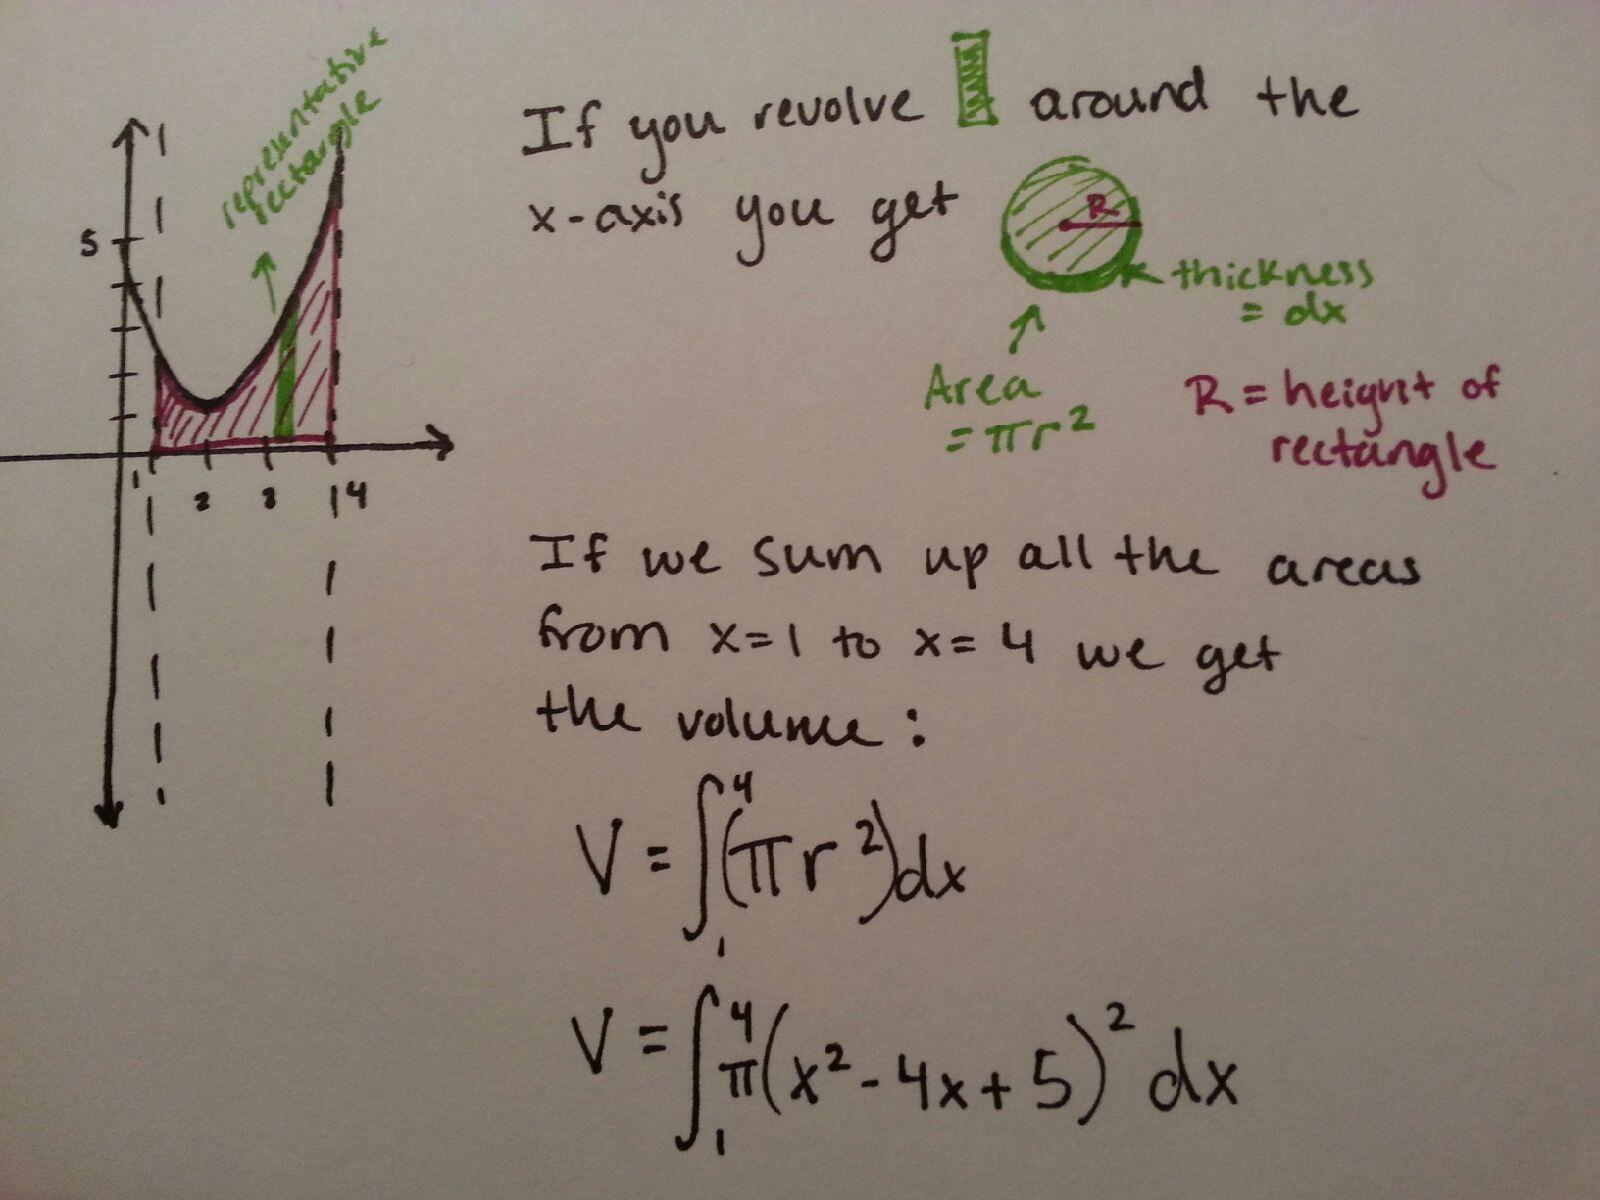
To find the volume we use a representative rectangle from the region we are finding the volume of and rotate the rectangle around the x-axis. In this case we get a circle with some thickness - like a coin. The thickness of that coin is the change in x, or the base of the rectangle and we call it dx. The height of the rectangle is the radius of the coin. If we sum the area of all the coins from 1 to 4 then we get the volume of the region rotated around the x-axis.
- ex/
,
,
. Rotate about the x-axis

In this example when we rotate our representative rectangle around the x-axis we get a circle with a hole in it. It looks like a washer. To find the area of the washer we find the area of the bigger circle and subtract the area of the smaller circle from it. Then to find the volume we sum all those areas from 0 to 4. Shown above.
IW 4: p. 410/9, 11, 13, 19, 23, 66, 67
and Quiz on Wednesday IWs 1-4
Next scribe will be Connor!
No comments:
Post a Comment