Showing posts with label Margaux. Show all posts
Showing posts with label Margaux. Show all posts
Tuesday, May 28, 2013

Tuesday, March 12, 2013
Scribe 3/11
We started class today by going over all the questions that were posted from IW 2 and 3.
IW 2:
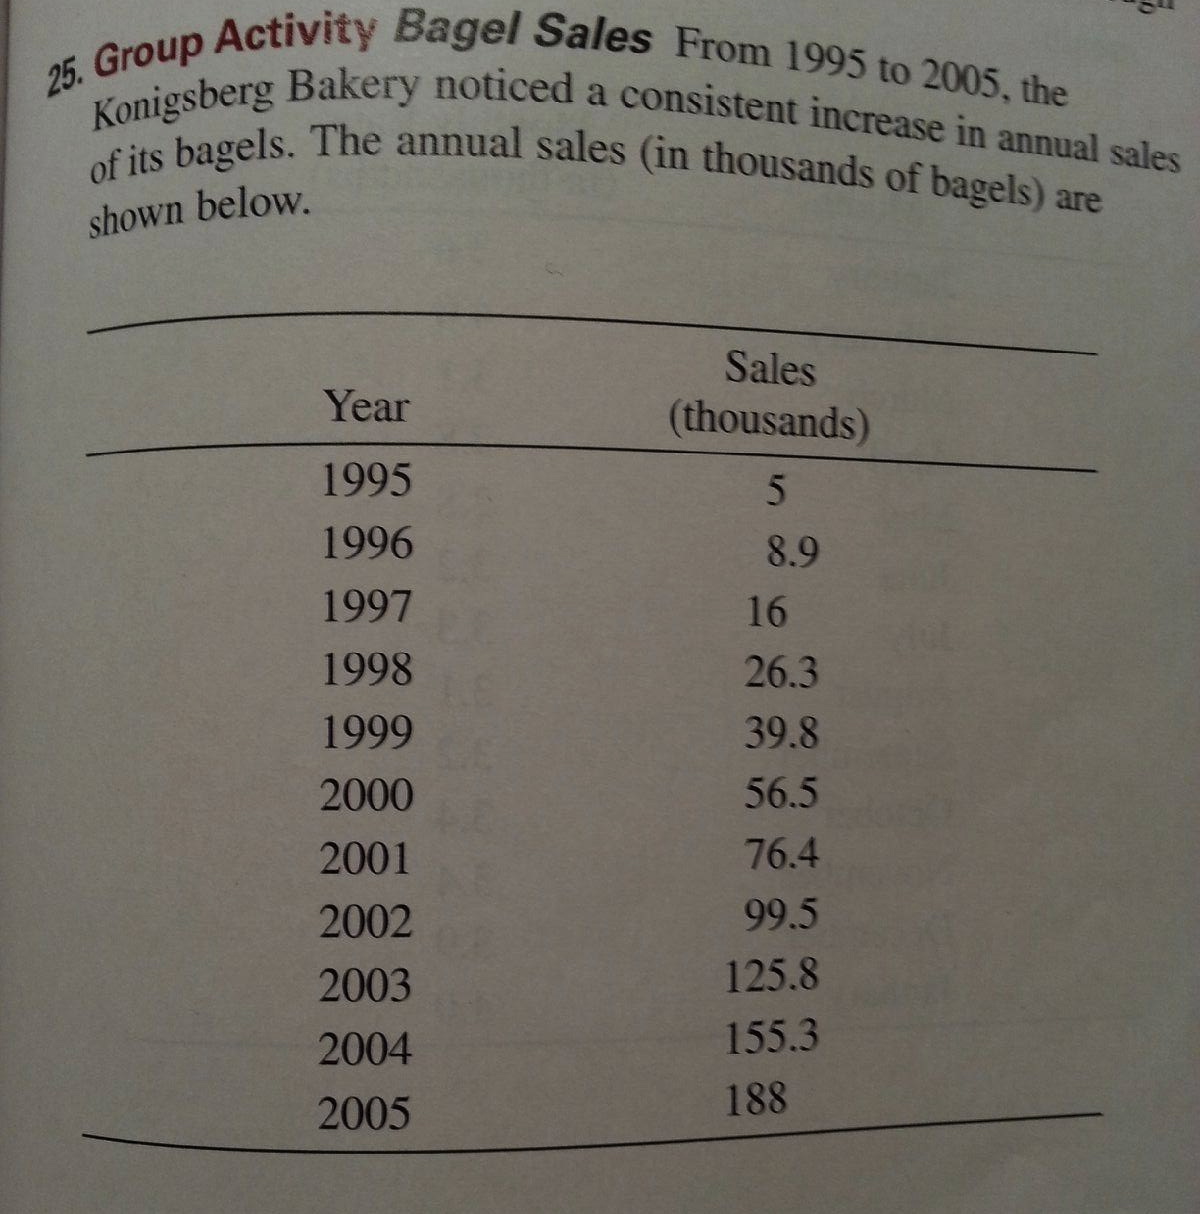
25) This problem was a quadratic regression problem (good thing to know for the quiz on Wednesday). It gave a set of data and asked you to use that data to find a quadratic equation that fit the given data. To do this we use our graphing calculators.
33) This problem asked you to find the area between the two given curves over a certain interval.
Because we are only finding the area we can switch the x and the y and still get the same area.
IW 2:
25) This problem was a quadratic regression problem (good thing to know for the quiz on Wednesday). It gave a set of data and asked you to use that data to find a quadratic equation that fit the given data. To do this we use our graphing calculators.
- First the data has to be entered into the calculator as a list: STAT -> edit -> enter data into L1 and L2 - in this case L1 is the year and L2 is the sales. To find the total number of sales made all you have to do is sum L2: 2nd -> STAT -> scroll over to math at the top -> 5. sum(. Then put in L2 by doing 2nd -> 2 and enter. That will give you the total number of sales, or the sum of list 2.
- Once data is in the list to get a graph go to 2nd -> Y= -> choose Plot 1. This gives you options for your graph. Now you can graph it. After graphing it go to zoomstat to automatically set the window.
- Now to see the regression or the quadratic that fits the data points on the graph go to: STAT -> over to CALC at the top -> down to 5. QuadReg and hit enter. This will give you the a,b, and c values for the quadratic equation.
- QuadReg by default does a regression for L1 and L2 but you can add other lists too. You can also do QuadReg -> VARS -> Y-VARS -> function -> Y1. Which puts the quadratic equation generated by QuadReg in for Y1.
- To calculate the integral you go to your graph and do 2nd -> CALC -> 7th option. The problem with integrating from the graph is that it isn't as accurate as fnInt, so its not the best thing to use on the AP test but it does give you a nice visual representation of what the fnInt value is.
33) This problem asked you to find the area between the two given curves over a certain interval.
Because we are only finding the area we can switch the x and the y and still get the same area.


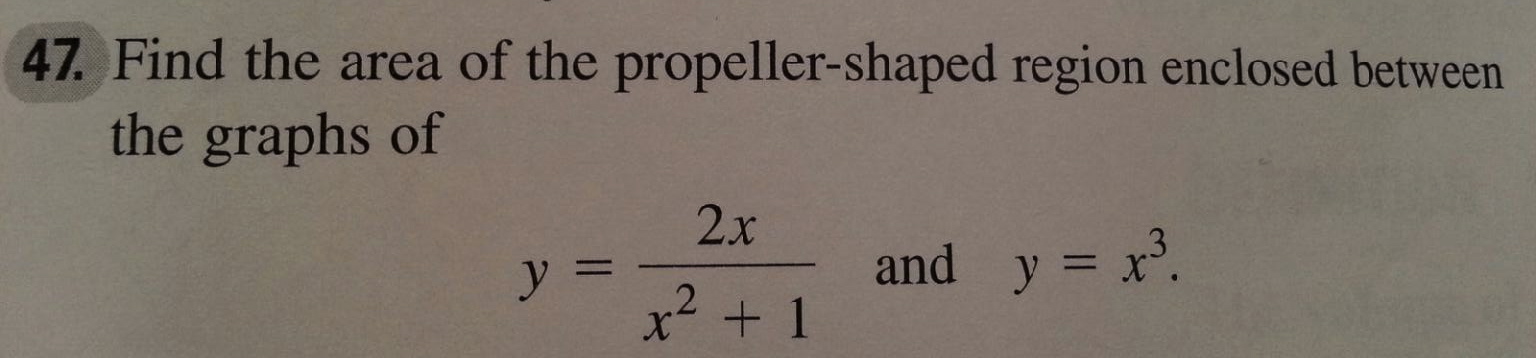
47) Another area between curves problem.

Volumes:
After learning how to find the area between two curves last class, today we learned how to find the volume between two curves. Mr. O'Brien explained it to us with a few different example problems.
- ex/ The region bounded by
,
, and
is rotated about the x-axis. Find the volume.
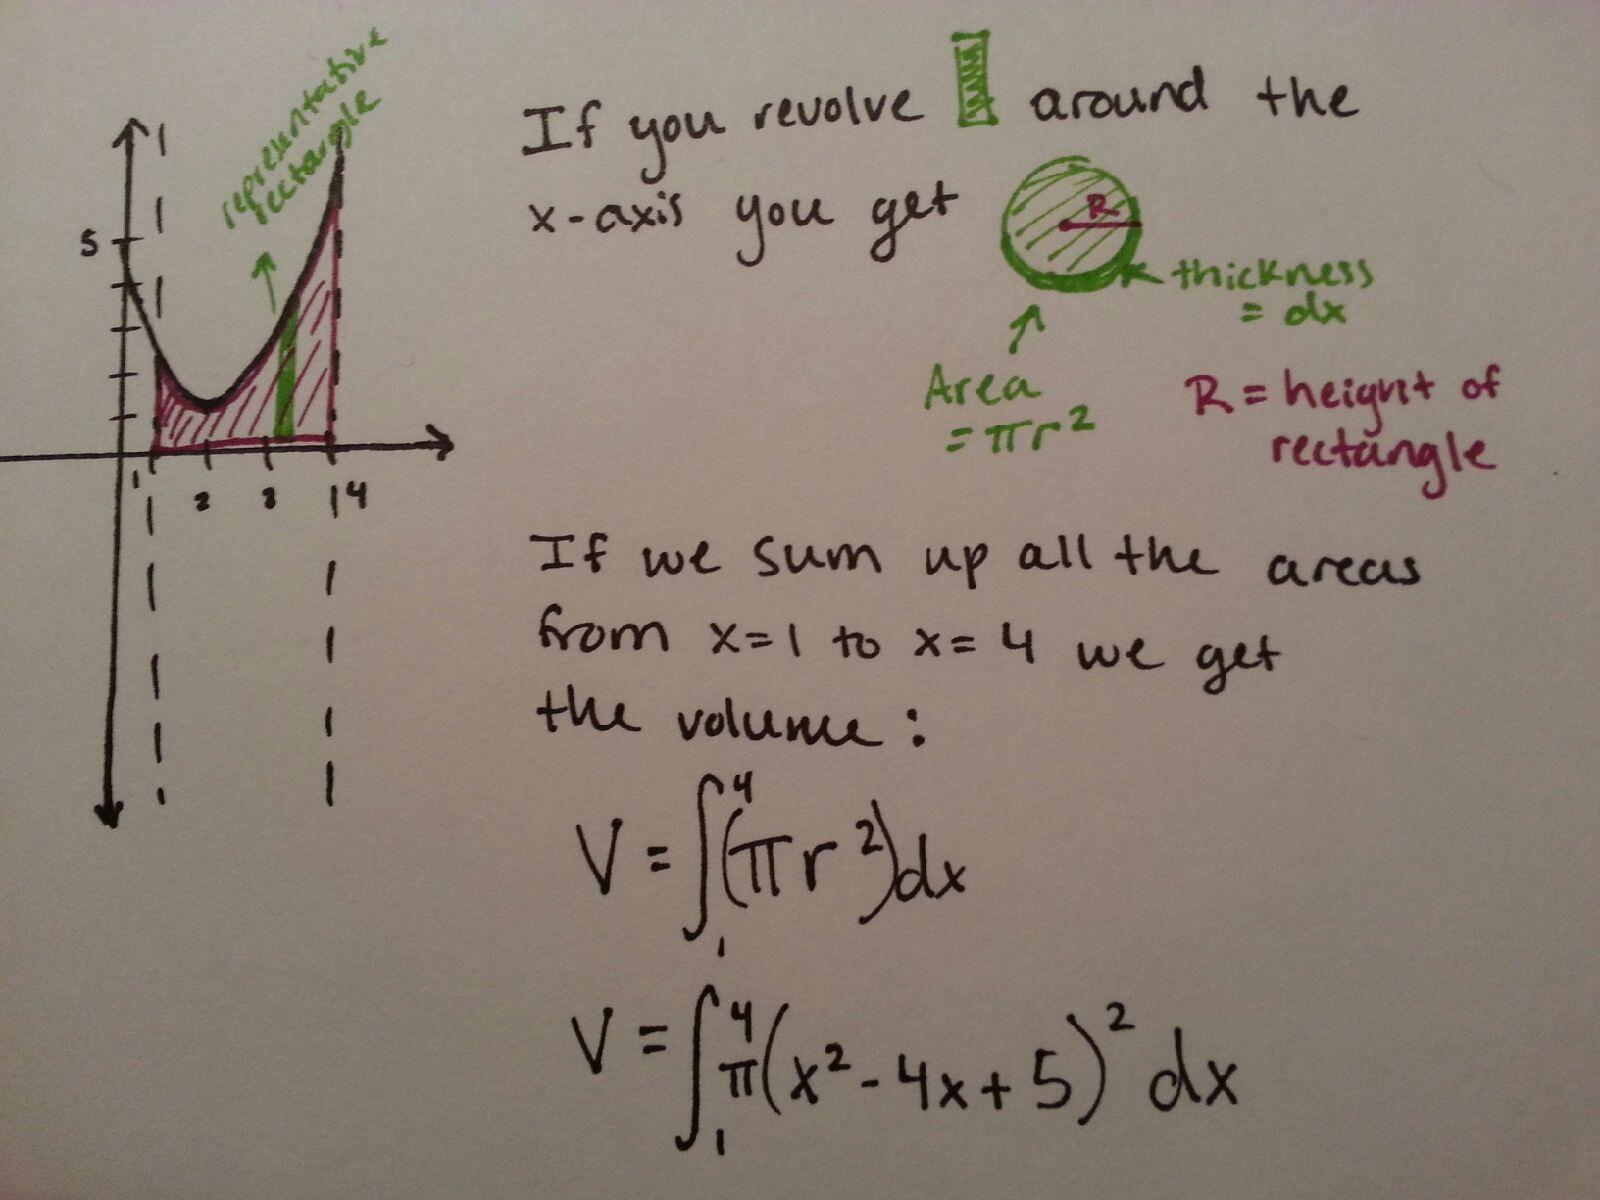
To find the volume we use a representative rectangle from the region we are finding the volume of and rotate the rectangle around the x-axis. In this case we get a circle with some thickness - like a coin. The thickness of that coin is the change in x, or the base of the rectangle and we call it dx. The height of the rectangle is the radius of the coin. If we sum the area of all the coins from 1 to 4 then we get the volume of the region rotated around the x-axis.
- ex/
,
,
. Rotate about the x-axis

In this example when we rotate our representative rectangle around the x-axis we get a circle with a hole in it. It looks like a washer. To find the area of the washer we find the area of the bigger circle and subtract the area of the smaller circle from it. Then to find the volume we sum all those areas from 0 to 4. Shown above.
IW 4: p. 410/9, 11, 13, 19, 23, 66, 67
and Quiz on Wednesday IWs 1-4
Next scribe will be Connor!
Friday, March 8, 2013
Scribe Post 3/7
Today Mr. O’Brien started class by reminding us that only two of us had signed up for the AP test and the rest of us should sign up soon. Then we got our supercorrection follow-up tests back and went over the problems to make sure we fully understood each one.
Follow-up test:
1. Use fnInt!
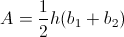
2. Use trapezoidal rule and remember the area of a trapezoid:
3. Average velocity:
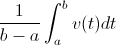
Easy mistake to make is forgetting to multiply by the fraction in front.
4. a. Find acceleration using nDeriv
b. Total distance:

Absolute value around the function because distance cannot be negative so it makes the part of the graph below the x axis positive.
c. Position at t=5: use the fundamental theorem of calculus.


5. Find the antiderivative. Don't forget to add C. Check to make sure you are right by taking the derivative.
6. Find antiderivative of the function then subtract the antiderivative evaluated at a from the antiderivative evaluated at b.
7. Sketch a graph of the absolute value of x shifted to the right two and up one. Then either form two trapezoids and sum their areas or count squares.
8. Separate the integral then use the graph to integrate each and add them together.
9. Integration rules.
After all remaining questions about the test were answered Mr. O'Brien informed us that after class on Monday we would be done with calculus! After Monday we will review up until the AP test. Before we moved onto an example problem of the new stuff we looked at number 47 from IW 1.
IW1:
47) u substitution problem.

Area between curves:
Then
we moved on to look at the first part of the new section by staring a
free response question from the 2000 AP exam. In this last section we
are going to be finding the area of anything whose boundary is
determined by a mathematical curve. After this section we will have a
way to calculate the area and the volume of objects in the real world. 
This question asks us to find the area of region R which is bound by two curves.
First use a representative rectangle which is a rectangle like you would use to find a Riemann sum. Then find a function for the height of the rectangle and find a base.
Base: change in x which is known as dx.
Height: the difference between the top point and the bottom point.
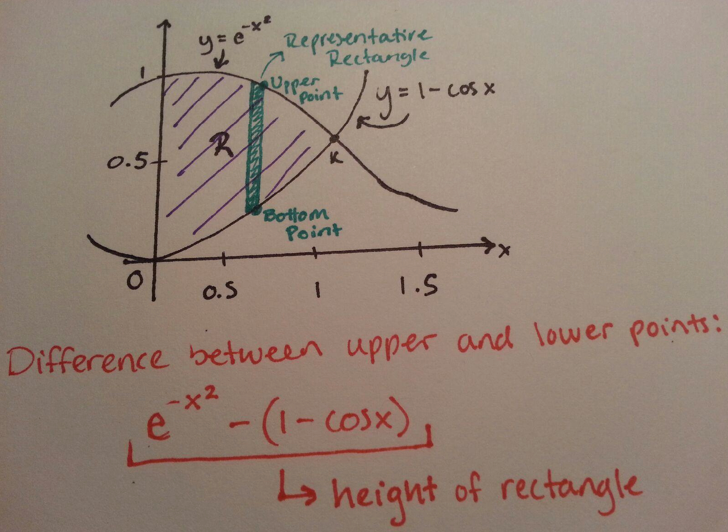
Now we sum the height times the dx from 0 to 1 and we get this integral.

Now we can use fnInt to solve this integral, giving us the area of region R.
As long as you subtract the top from the bottom it doesn't matter what quadrant you are in, the areas between the curves will always be positive.
IW3 pg 399 Example problem for finding the area between two curves.
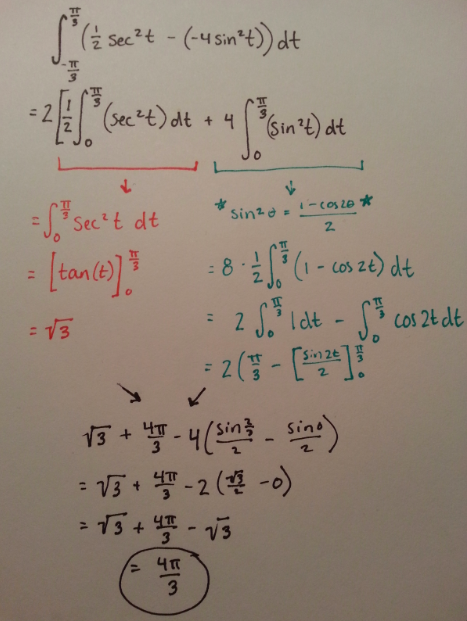
2) Find area of the shaded region. No technology.

We do this problem the same way we did the free response problem. Find the height of a representative rectangle by subtracting top from bottom and integrating. Once we find our height function we multiply it by the base and integrate to find the area:

This video gives a clear explanation of how to find the area between two curves as well as a demonstration on how to do it on your calculator.
IW 3 p. 399/2, 4, 10, 14
p. 401/3, 5, 13, 33, 39, 47, 49, 52, 53, 54, 55
Don't forget to post questions!
Next Scribe: ??
Subscribe to:
Posts (Atom)